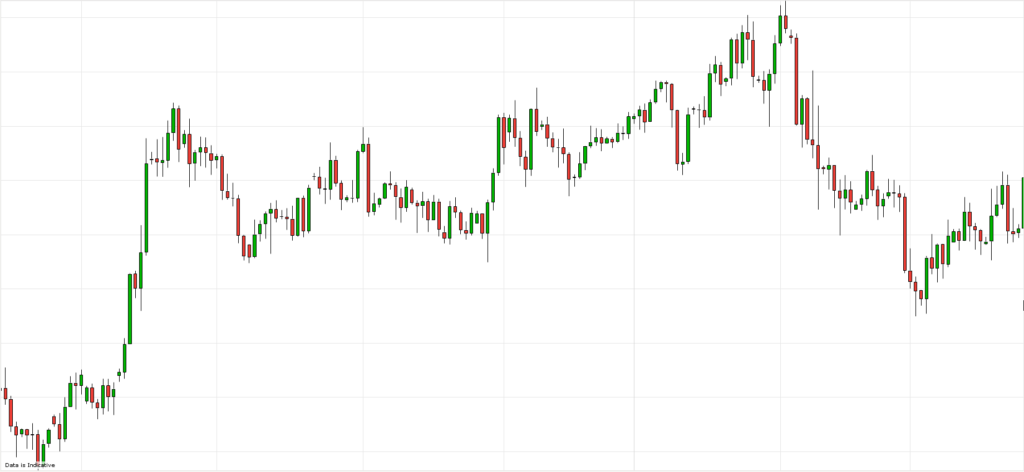
Here is a daily chart showing 6 months of data. The bars are called “Japanese candle sticks” and comprise a wax, and wick(s), usually one at either end of the candle.
On its own, it makes no sense. How do we pick winning days and filter out the days that we won’t trade?
Lets have a close look at an example algorithm referred to as GBP/JPY OSD. This is a low frequency but highly reliable trading strategy.
We apply 9 rules. 7 are what we can see on a completed chart, and 2 are risk/reward rules.
Our first rule is that we only buy on a green candle which closed higher than the top of the previous day’s wax. Conversely we only sell on a red candle which closed lower than the bottom of the previous day’s wax.