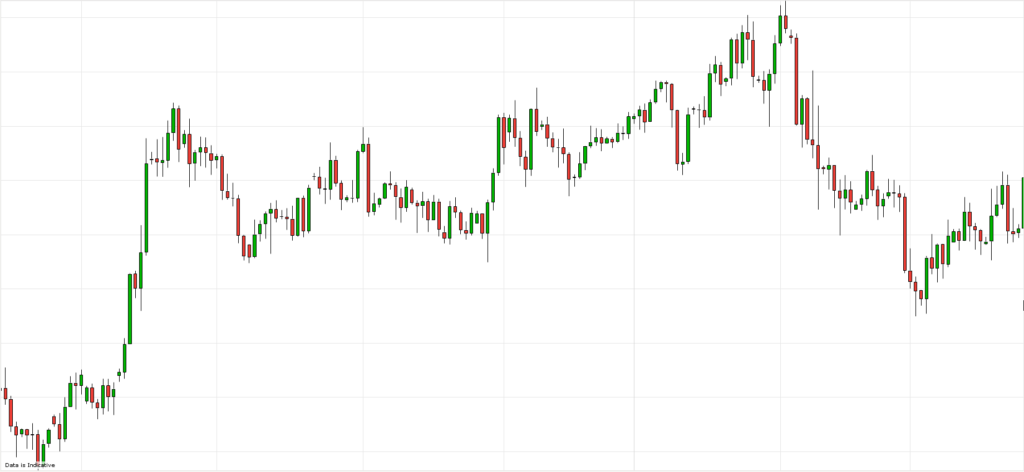

So, how do we filter out the grains of sand to find the diamonds in this chart?
Firstly, we apply exponential moving averages, 20, 50 and 100 day price information.
This gives us an indication of trend, and our next two rules; we may only buy above the 100 trend line, and we may only sell below that line.
We cannot trade if any part of the candle is touching the 100 trend line. But the information is still too loose, so, we need to tighten it up.