
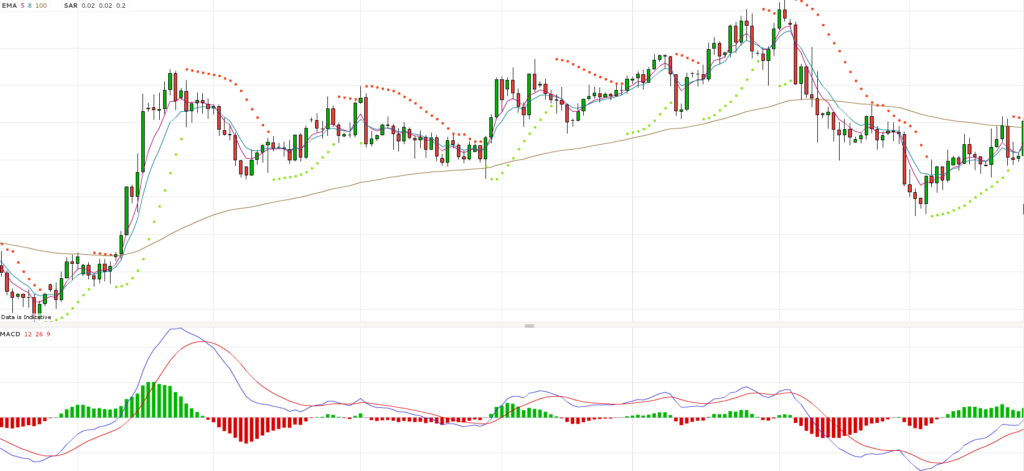
We now add the final layer of market information to give us a trade.
The green and red dots you can see are called Parabolic SAR. We only buy if there is a green dot beneath the candle, and we only sell if there is a red dot above the candle.
This is now a complete chart.
So, how do we decide how much to invest?